Of the Moment...
- LIVE NOW!! - Checkout my 4D project website: www.thermalsited.com
Chapters
Details
Title: IDAT307 - 4D
Start Date: 10-10-2008 01:15
Finish Date: 16-03-2009 12:00
Status: Pre-Production
Aditional Details: Individual University Coursework - 20 credits
Site Down
Posted: Friday 1st May 2009
I have had to take the website offline as the time with the server has run out. I will be adding offline versions of the simulations as well as images and videos of the project to this section in the next few weeks.
Posted by Admin 0 Comments
A New Approach
Posted: Sunday 15th March 2009
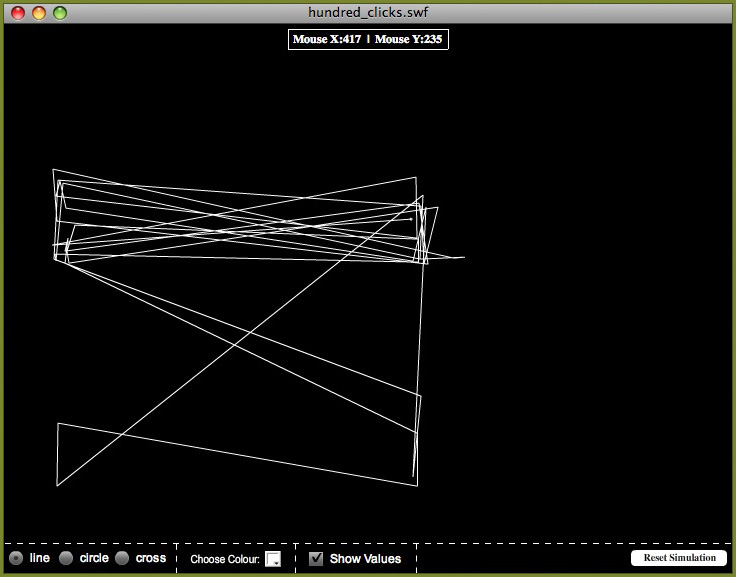
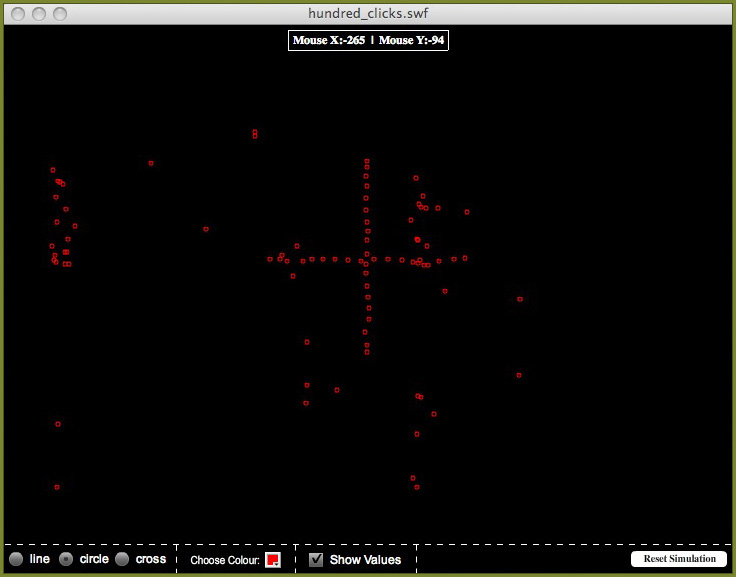
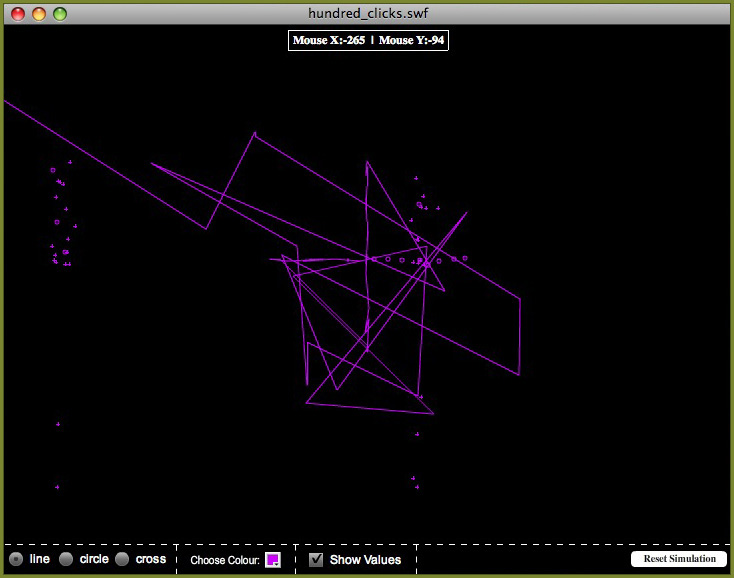
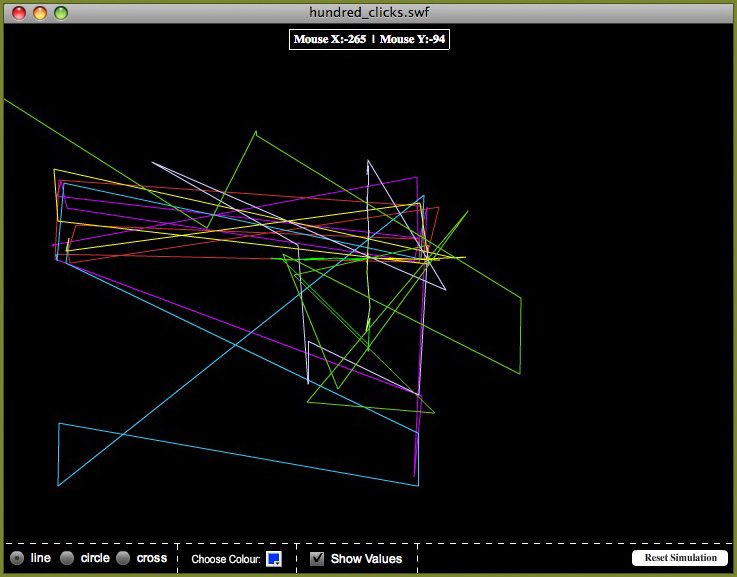
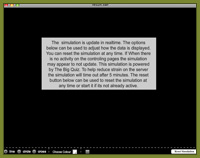
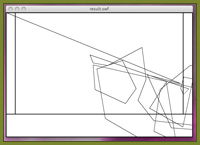
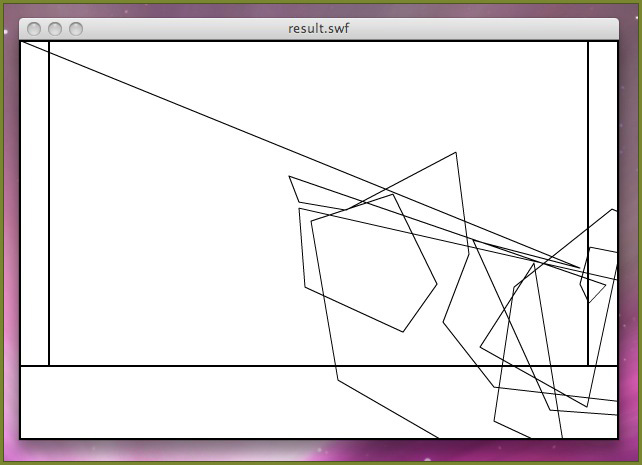
Even though I have moved my project to a new server I have decided to change the way I am approaching the project. Instead of the project updating each second it will no only update once per run and return the latest X (at the moment 100) posts from the database. All the X records are returned and once, resulting in the need for only one call to the database. The data is now returned as XML, which makes it much easier to use within the flash. Each of the XML entries are displayed one at a time over X seconds. The screen shots below shows what the simulation will look like after about 50 and 100 iterations as well as using different styles:
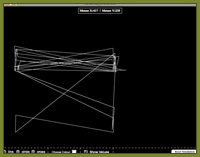
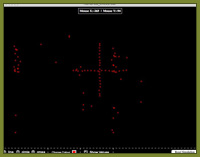
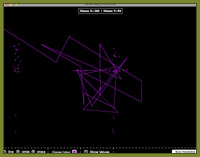
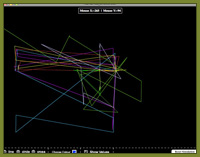
At the moment I’m only using the mouse X and Y co-ordinates. The next stage of the project is to call in the rest of the data. I would also like to add in other options such as only showing the data for the current user or for a particular page.
At the moment I’m only using the mouse X and Y co-ordinates. The next stage of the project is to call in the rest of the data. I would also like to add in other options such as only showing the data for the current user or for a particular page.
Posted by Admin 0 Comments
Update on Server
Posted: Saturday 14th March 2009
I have decided that even if I change the way the project works it still is quite a server heavy system and therefore the safest option will be to move it to its own server. I have been able to get access to a free beta trial of vps.net so have moved the project to that. The new virtual server has been setup with Ubuntu (Linux) and LAMP has been installed. On top of this the server has also been configured with ftp and phpMyAdmin. Access to the server is by SSH; I have used both terminal (on Mac) and Putty (on Windows).
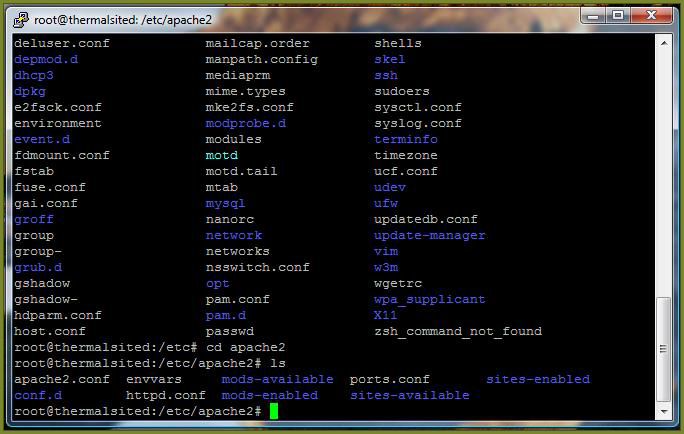
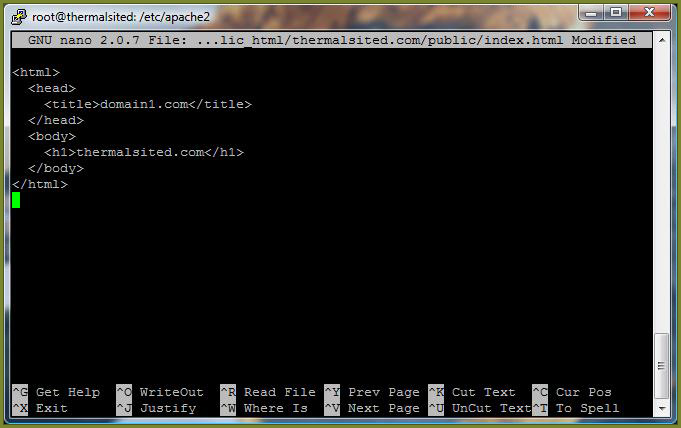
Since I have not had a chance to learn the use of SSH in detail a lot of the setup was carried out for me, but it did have time to get to grips with the basic commands and some of the configuration. Here are some screen shots of the SSH work.
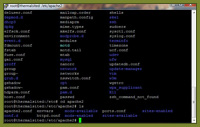
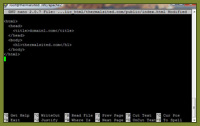
All the content from the old server has been moved over to the new server and everything has been made live. Although the project is now on its own server and no longer risking other sites I am still quite concerned that the current state of my project is too much for the server, so will be looking into ways I can change it to help reduce this problem.
Since I have not had a chance to learn the use of SSH in detail a lot of the setup was carried out for me, but it did have time to get to grips with the basic commands and some of the configuration. Here are some screen shots of the SSH work.
All the content from the old server has been moved over to the new server and everything has been made live. Although the project is now on its own server and no longer risking other sites I am still quite concerned that the current state of my project is too much for the server, so will be looking into ways I can change it to help reduce this problem.
Posted by Admin 0 Comments
Flash and Problems
Posted: Sunday 8th March 2009
Work on the flash is going well, although progress is a little slower than I would like. On top of that I’ve starting running into problems I had not anticipated.
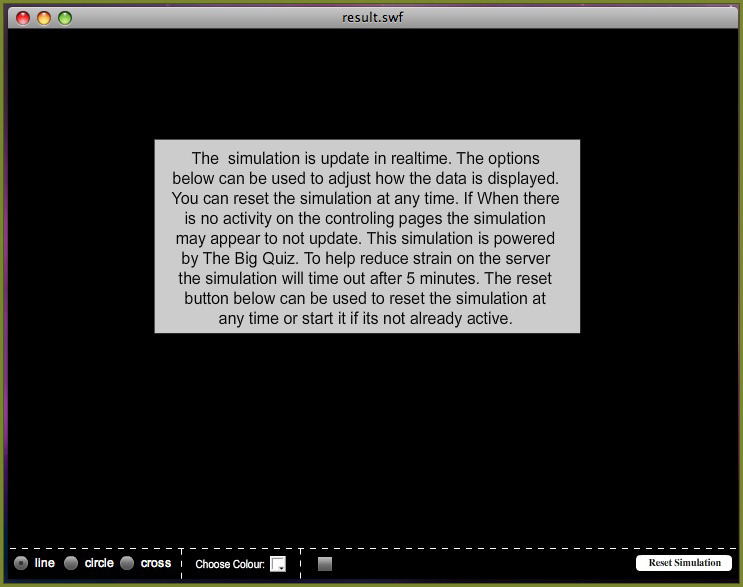
I have added 3 display types (cross, circle and line) to represent the data as well as an option to change the colour. I have also made adjustments to the co-ordinates to allow for the side menu on the webpage, which is not included in the simulation. What I have so far is shown below.
I am also hoping to add an option to visualise the data associated with the click at the top of the screen to help make what is happening a little clearer. At the moment however I have a bigger problem to content with.
At the moment the flash updates once per second, the problem is that these seems to be too much for the server to handle, every so often a new request is sent before a pervious one has had a chance to complete. One option I’m looking into at the moment is moving the project to its own virtual server. This will involve a lot of extra work so I will also be looking into other solutions to the problem at the same time.
Posted by Admin 0 Comments
Flash Simulations
Posted: Sunday 8th March 2009
My intention is to produce a variety of different flash simulations, which will be powered by the collected data in the genetics table. In a previous post I mentioned linking php and flash. I will now be building upon this idea.
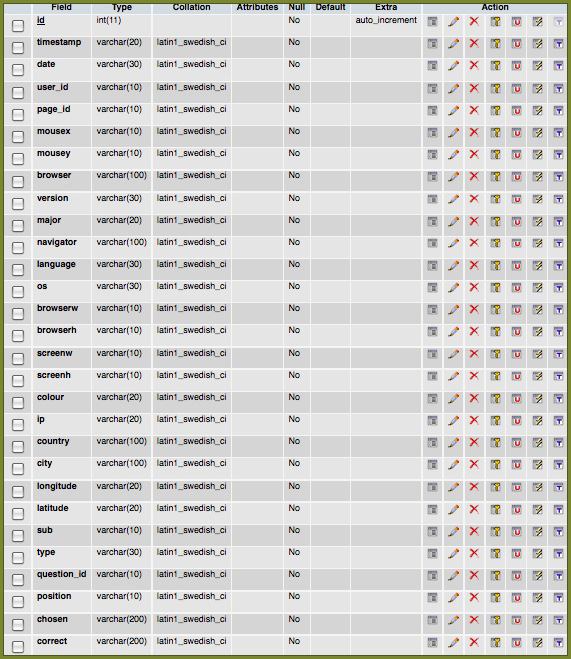
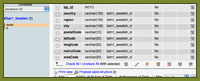
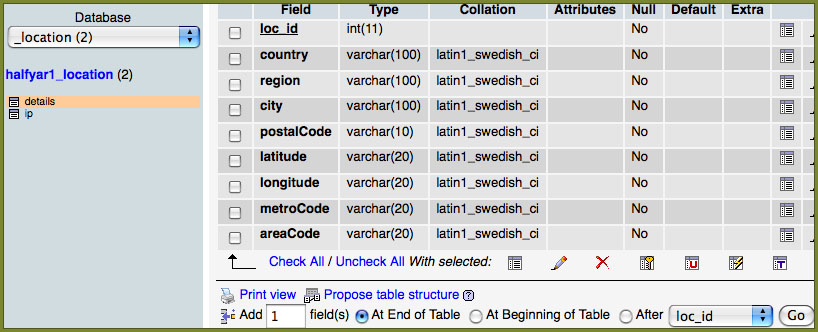
Having now written the required code to collect the data, the fields in the genetics table have changed slightly. For the most part this was just a case of renaming some of the fields although a few have been dropped where I decided the data would not be useful and a couple of new ones added. The new database structure is shown below.
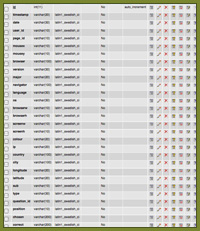
The first simulation I am working on will only be using the mouse x and y co-ordinates. As there is no need for the rest of the data to be returned from the database I have written a custom php file for this simulation.
I have also made some changes to the flash file. The most important of these is using a timer to call the php instead of reloading the frame. This has given me more control over making the request.
I have also written the basic code to output the information in a graphical form. At the moment the output and interface still need a lot of formatting, but the screenshot below shows the basic idea.
Having now written the required code to collect the data, the fields in the genetics table have changed slightly. For the most part this was just a case of renaming some of the fields although a few have been dropped where I decided the data would not be useful and a couple of new ones added. The new database structure is shown below.
The first simulation I am working on will only be using the mouse x and y co-ordinates. As there is no need for the rest of the data to be returned from the database I have written a custom php file for this simulation.
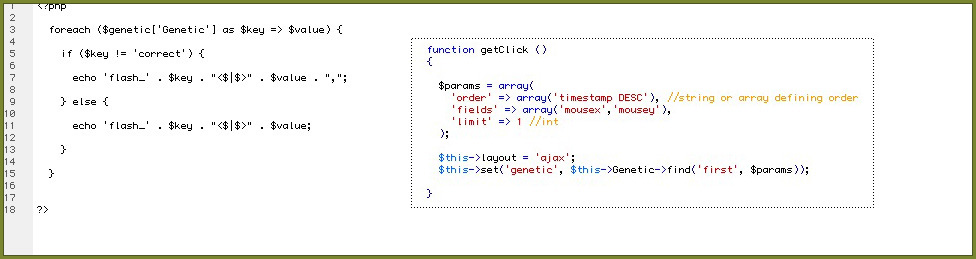
I have also made some changes to the flash file. The most important of these is using a timer to call the php instead of reloading the frame. This has given me more control over making the request.
I have also written the basic code to output the information in a graphical form. At the moment the output and interface still need a lot of formatting, but the screenshot below shows the basic idea.
Posted by Admin 0 Comments
Design Change
Posted: Thursday 5th March 2009
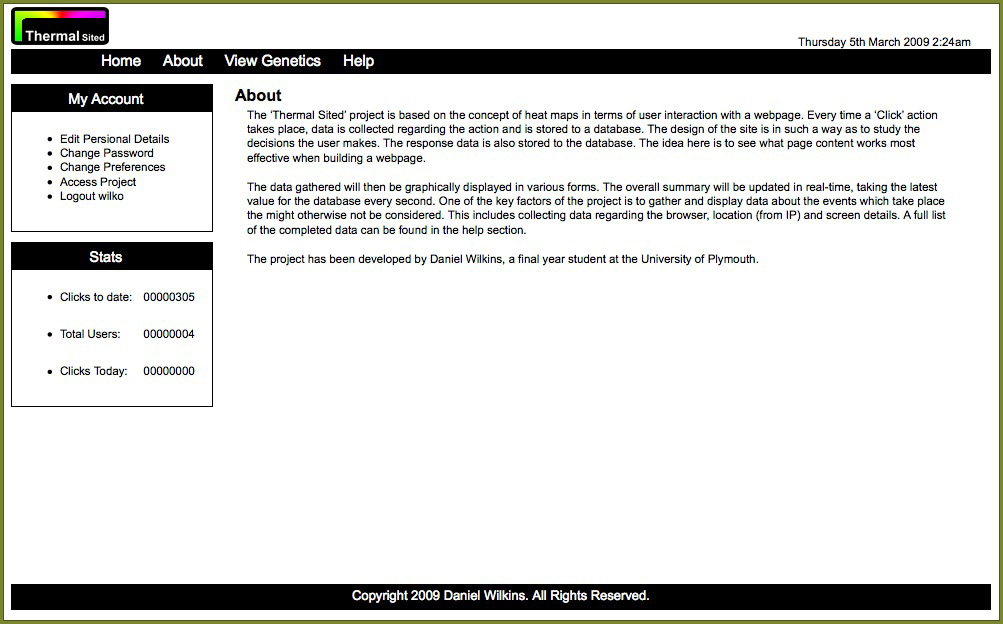
Today I had a meeting with my tutor regarding the project so far. One of the suggestions made was that the website might work better using less colour allowing the main content of the project to stand out more.
I have now changed the website to consist of only black and white and have adjusted the logo to be more in keeping with the new design.

I have now changed the website to consist of only black and white and have adjusted the logo to be more in keeping with the new design.
Posted by Admin 0 Comments
Interface and Site Designs
Posted: Thursday 5th March 2009
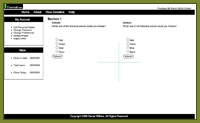
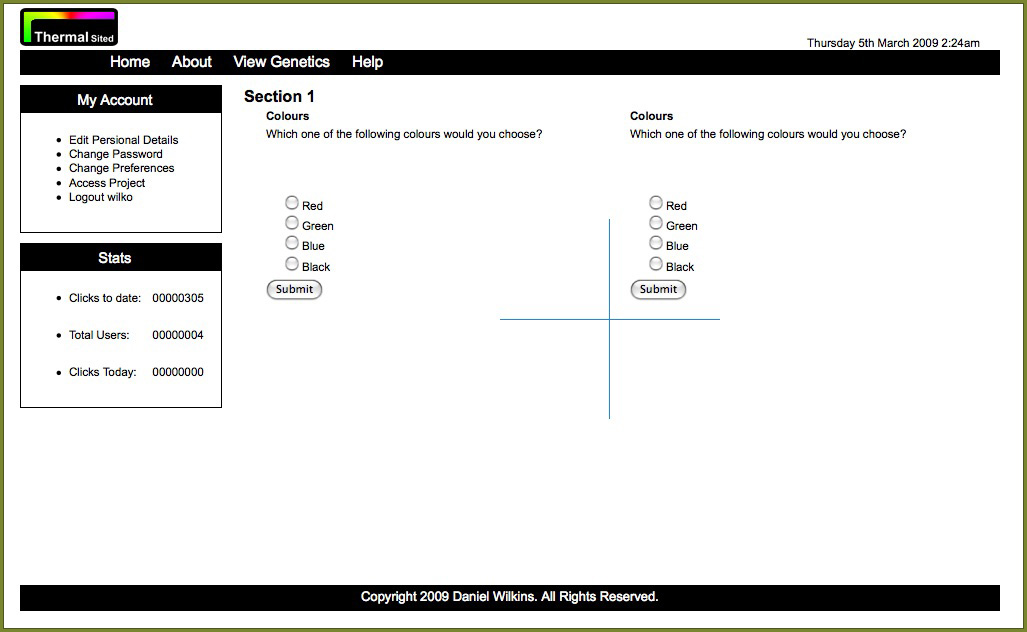
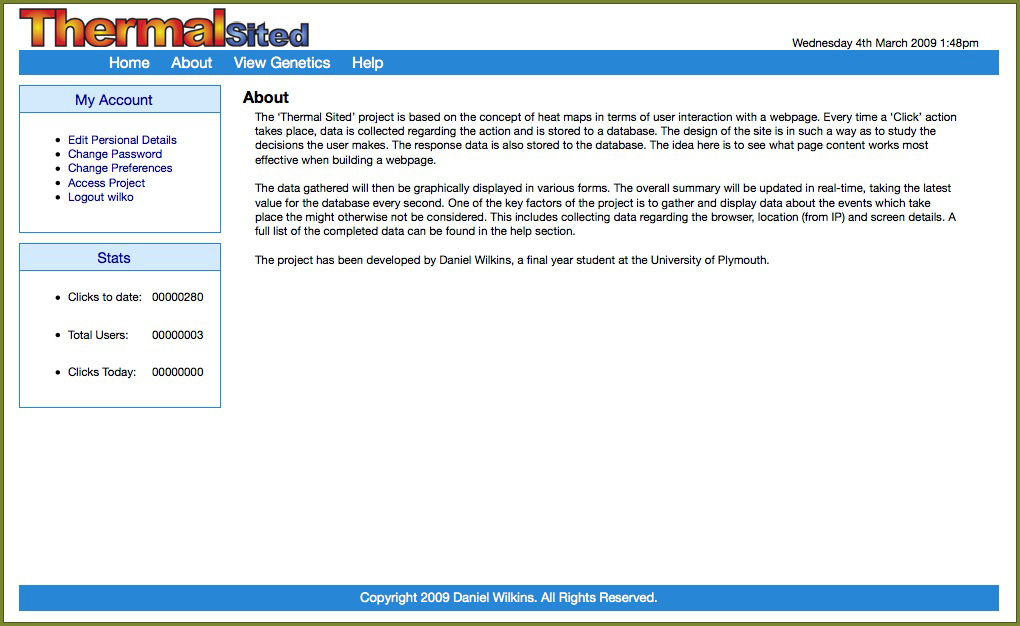
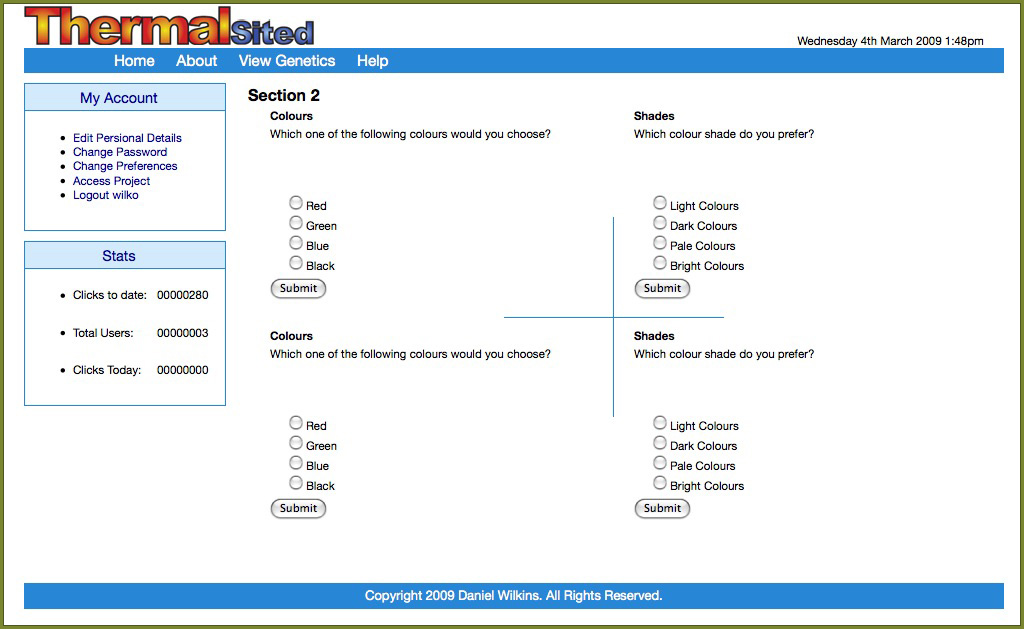
Progress on the project is coming along well, with the main interface design starting to come together. The images below show what the site looks like at this time. Most of the work the on the project the past few weeks has been behind the scenes. I now have a complete login and registration system to control and manage access to the project.
I have also spent a lot of time the past week working on the required code to collect the various data’s for the user and store them to the database. Some of the information, such as IP address which will not change during a session is collected by the php when the user logs in, while other variables such as click position is updated by an AJAX call from within the pages.
I have also spent a lot of time the past week working on the required code to collect the various data’s for the user and store them to the database. Some of the information, such as IP address which will not change during a session is collected by the php when the user logs in, while other variables such as click position is updated by an AJAX call from within the pages.
Posted by Admin 0 Comments
PHP and Flash
Posted: Wednesday 11th February 2009
The next stage of the project is to get the genetics data from the database into flash so it can be manipulated for the simulation. To start with I have added a couple of rows of dummy data to the genetics table. This will allow me to work on the flash without having to build the website first, as the flash is the most important part of the project.
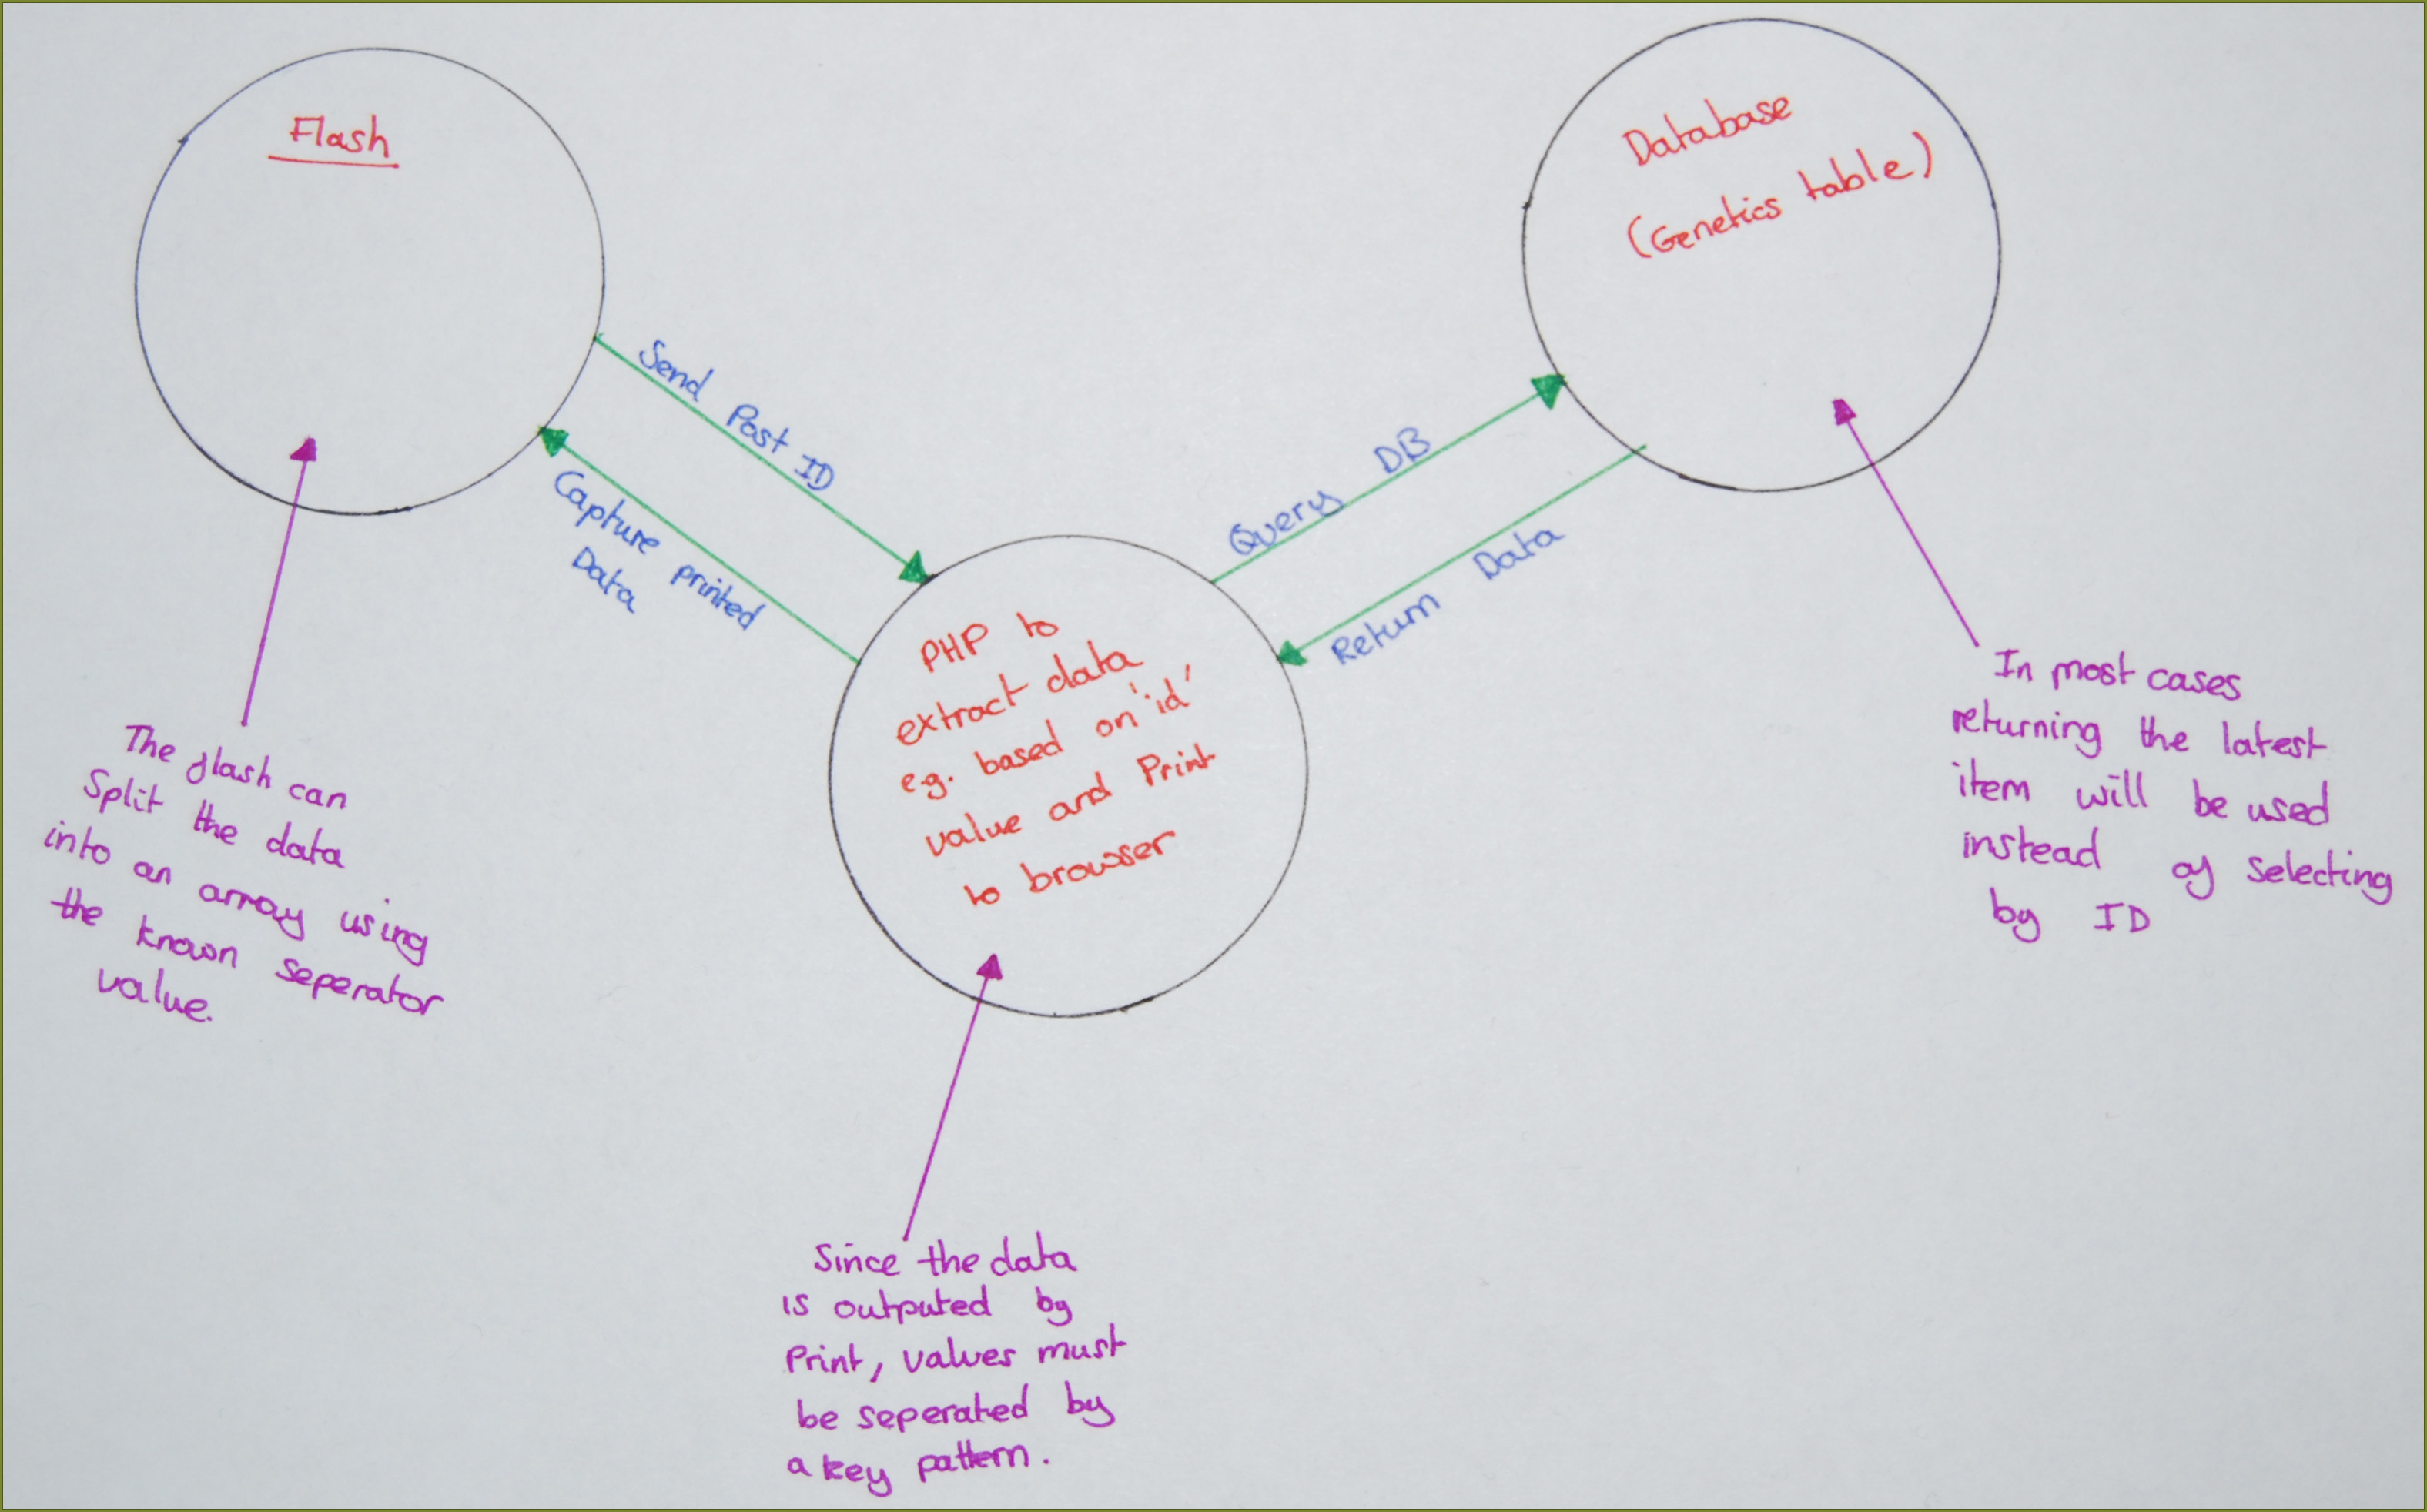
Having carried out some research into extracting the data using flash, my understanding is that the flash will be submitted to the php in the same way variables are passed between pages in the URL. The PHP then queries the database in the usual way. The php then prints out the data, which is then captured by the flash. Since the data is outputted as a single string a separator string is used between the values, which the flash can then use to spit the data into an array. This is shown more in the diagram below.

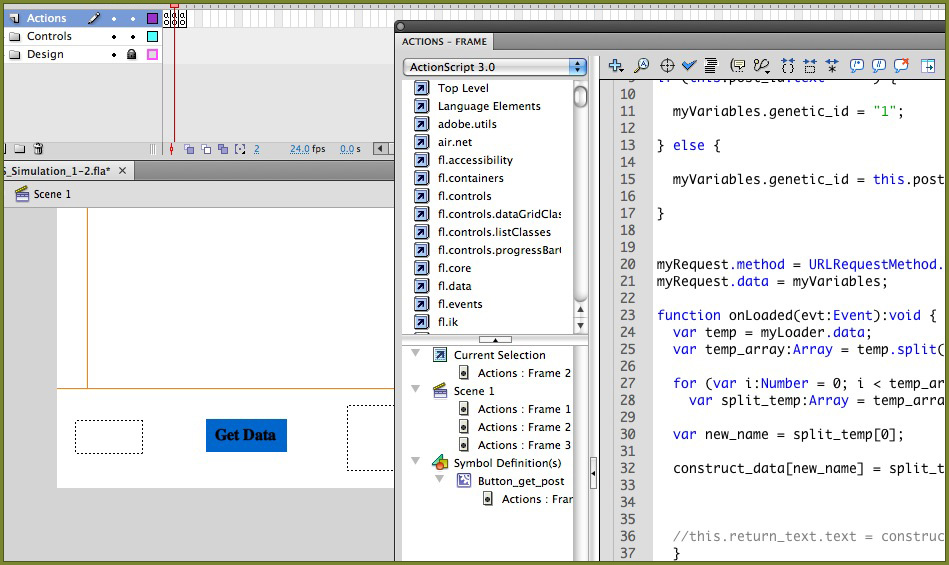
The first stage is to try and get the data into the flash, and by adding in the option to choose the genetic ID a change in the displayed data can be seen. For the actual simulation the latest genetic data will need to be chosen and updated on a timer, the problem with this direction is that data would need to be added to the database in order to see a change in the flash and so isn’t as useful for testing purposes.
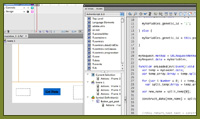
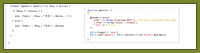
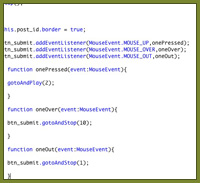
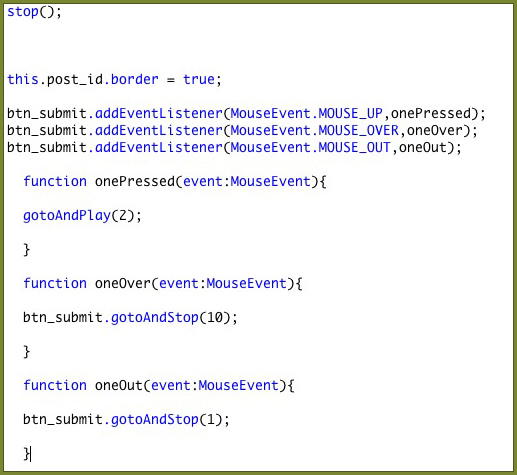
The first frame of the main timeline is used to setup the event listeners for the button, two of which are just used to indicate the mouse over of the button, while the “MouseEvent.MOUSE_UP” is used to trigger a function to get the data. When the event is triggered the main timeline is moved to the second frame.
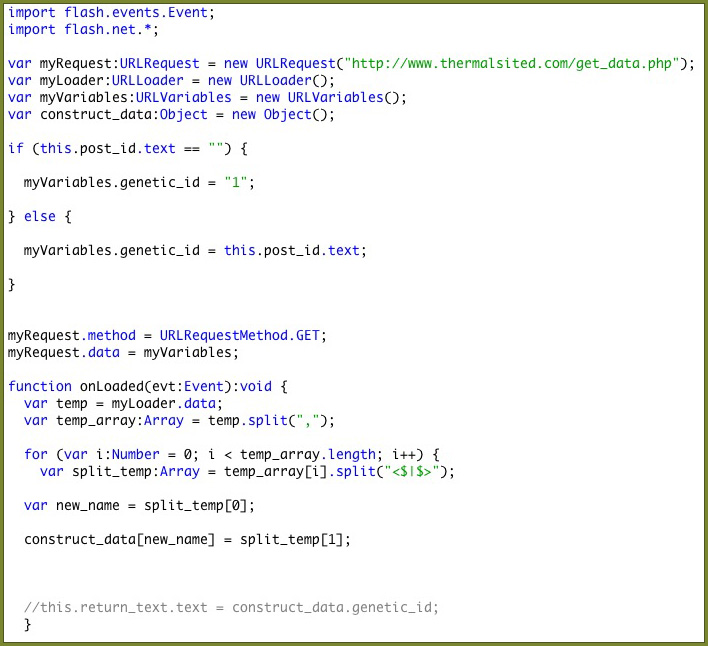
The ‘URLRequest’ object takes the address of the php file to be called. It can be a relative address if the flash resides on the same server as the php or absolute if the flash is on a remote server. The URLVariable object has properties for each of the variables to be included with the url or posted with the request.
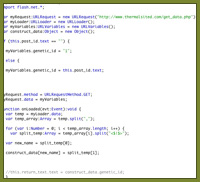
The variable being sent in this case is “.genetic_id”. All the variables are assigned using the “.data” property and the transmission method (POST or GET) is chosen using the “.method” property. Once the request is completed a function is triggered to process the returned data. A for loop along with the predefined separator is used to split the data into an array.
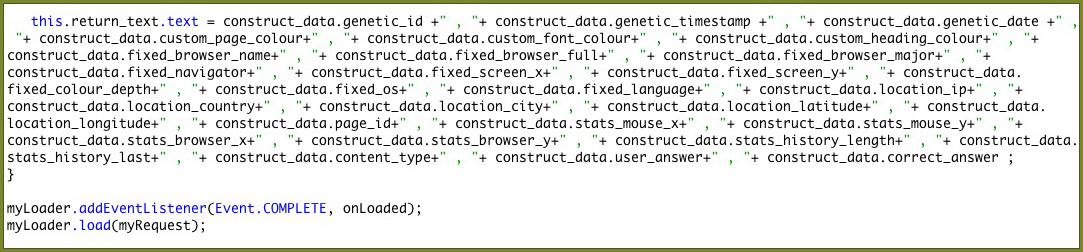
The data is displayed in a textbox by outputting the values contained in the array. The values are called by the same names as the fields in the database table.

And the result of the request is:

Having carried out some research into extracting the data using flash, my understanding is that the flash will be submitted to the php in the same way variables are passed between pages in the URL. The PHP then queries the database in the usual way. The php then prints out the data, which is then captured by the flash. Since the data is outputted as a single string a separator string is used between the values, which the flash can then use to spit the data into an array. This is shown more in the diagram below.
The first stage is to try and get the data into the flash, and by adding in the option to choose the genetic ID a change in the displayed data can be seen. For the actual simulation the latest genetic data will need to be chosen and updated on a timer, the problem with this direction is that data would need to be added to the database in order to see a change in the flash and so isn’t as useful for testing purposes.
The first frame of the main timeline is used to setup the event listeners for the button, two of which are just used to indicate the mouse over of the button, while the “MouseEvent.MOUSE_UP” is used to trigger a function to get the data. When the event is triggered the main timeline is moved to the second frame.
The ‘URLRequest’ object takes the address of the php file to be called. It can be a relative address if the flash resides on the same server as the php or absolute if the flash is on a remote server. The URLVariable object has properties for each of the variables to be included with the url or posted with the request.
The variable being sent in this case is “.genetic_id”. All the variables are assigned using the “.data” property and the transmission method (POST or GET) is chosen using the “.method” property. Once the request is completed a function is triggered to process the returned data. A for loop along with the predefined separator is used to split the data into an array.
The data is displayed in a textbox by outputting the values contained in the array. The values are called by the same names as the fields in the database table.
And the result of the request is:

Posted by Admin 0 Comments
GeoLite City Installation
Posted: Wednesday 21st January 2009
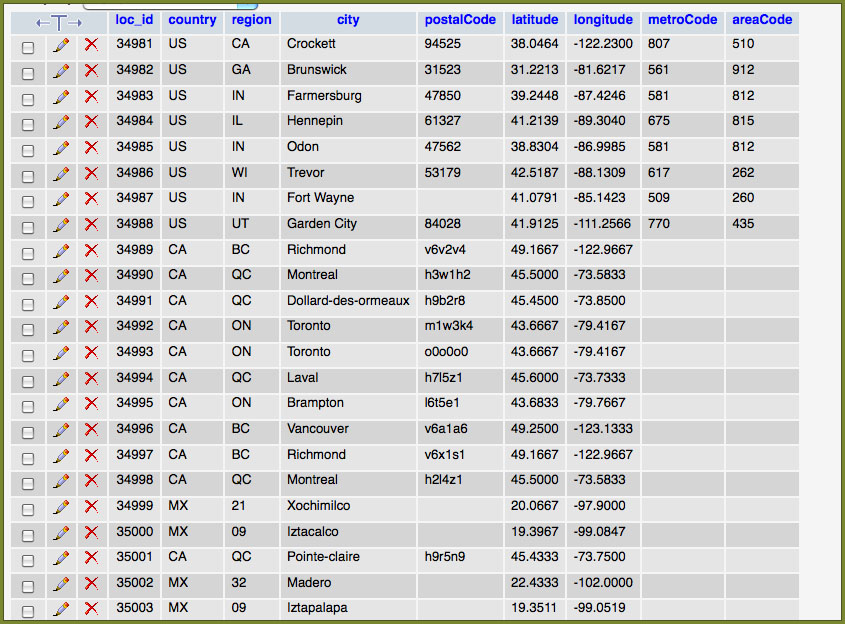
Since the database is over 100 Meg in size I decided to install it on a secondary server as I only have limited space on my main server. There are two tables for the IP lookup, the first contains a IP start and end range value, which corresponds to a reference that can be looked up in the second table to return the main details. The reason for this approach is that there will be more than one IP range within a city, so the IP range table is much bigger. This means there is no need to repeat data for each IP range saving space.
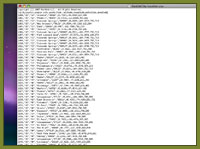
The CSV files only contained the table data and not the required SQL to create the database and tables. For this reason they had to be set up first manually. The second problem was that the CSV files were too big to import in one go so I had to divide the files up into smaller parts. The data can be seen clearer in the screen grabs shown below.
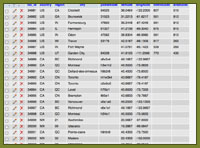
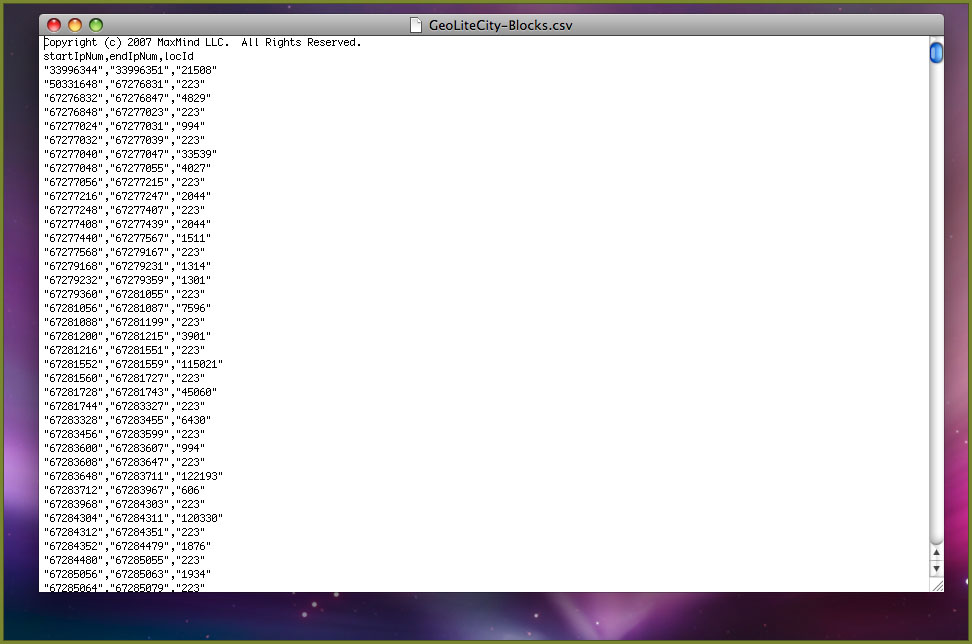
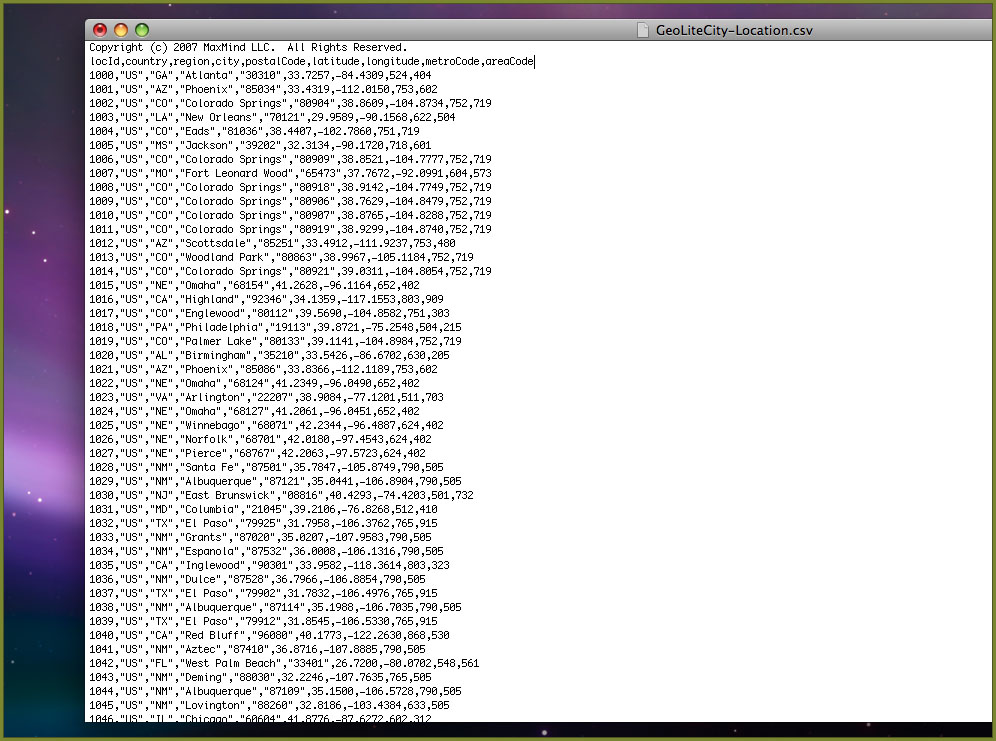
The CSV files only contained the table data and not the required SQL to create the database and tables. For this reason they had to be set up first manually. The second problem was that the CSV files were too big to import in one go so I had to divide the files up into smaller parts. The data can be seen clearer in the screen grabs shown below.
Posted by Admin 0 Comments
MaxMind – GeoLite City
Posted: Tuesday 20th January 2009
Part of the data collection for the project is to look at the spread of users interacting with the project across the world. All though data about user location cannot be collected directly, (at best only an estimate of the users country may be gathered), the users IP address can be intercepted and then using a location lookup table the corresponding city and country can be found. In addition the same process can often find the longitude and latitude values. These can then be used with the Google map API to plot the points.
The lookup tables are available in a variety of different forms. The simplest of these is an online form when individual IP addresses can be looked up. This is normally available free of charge, but requires user input of each IP address and is no good for an automated system. The second approach is where a provider gives access to a database, via a script where an IP can be looked up and the correct data returned. Since this cost a fair amount of money to maintain normally the service requires a subscription of is limited to a few lookups per day. Subscriptions to the service often run at over $100 a month to cover the cost of the potential volume of lookups.
The third approach and the method I have chosen to use a pre constructed database, which can be installed on your own server. This is often a much cheaper approach, as the cost of bandwidth etc is no longer the problem of the company providing the database. Having looked around online at a variety of different companies providing systems, the best I was able to find is by MaxMind . They provided two different databases, one, which can be purchased, and a free ‘lite’ version. The difference between the two versions is there is more data included with the purchased version, such as postcode and the data accuracy is slightly higher. The free version usage is also restricted to non-commercial usage. For this project the accuracy of the free version is more than acceptable and the licensing is correct for my needs.
Since IP addresses are always changing updates to the database are provided each month. The data can be used in existing SQL databases and updated by a CSV file or using a faster stand-alone binary format. I have decided to use the mySql approach, as it is simpler and will be fast enough for my requirements.
Posted by Admin 0 Comments
Search Posts
Hint: In the month field leave 'All' selected to return all posts from the chosen year.
Copyright 2008 Daniel Wilkins. All Rights Reserved.